
6-minute lesson · Strategy education
EMA cross + MACD confirmation
Learn to recognize a qualifying setup, distinguish confirmation from a new crossover, and locate the applicable risk rules.
01 · Recognize the setup
Three conditions, checked together
This lesson uses the saved SPY call configuration as a worked example. Start with the time. Look for a new upward EMA cross. Then check whether MACD confirms it. All three conditions must pass at the same point.
Condition 1
Morning window
Minutes 2–30 after open
8:32–9:00 a.m. Central, including the entire final minute.
Condition 2
EMA cross
Below → equal or above
EMA 9 crosses EMA 20 on one-minute underlying data. Already above is insufficient.
Condition 3
MACD confirmation
Histogram greater than zero
MACD is above its signal line. It does not need a fresh crossover or a rising histogram.
Exact morning window
The strategy accepts setups during minutes 2 through 30 after the regular market opens: 8:32–9:00 a.m. Central, or 9:32–10:00 a.m. Eastern. The system counts whole minutes, so the window includes the entire final minute, through 9:00:59 Central. A qualifying cross outside that window does not pass the entry rules.
Exact EMA condition
An exponential moving average, or EMA, tracks price while giving more weight to recent observations. EMA 9 reacts faster than EMA 20. This setup uses one-minute underlying data and requires EMA 9 to move from below EMA 20 to equal or above it. The EMA spread is EMA 9 minus EMA 20. The exact check is previous spread < 0 and current spread ≥ 0. EMA 9 already sitting above EMA 20 is insufficient.
Exact MACD condition
MACD means moving average convergence divergence. Its histogram measures the difference between the MACD line and its signal line. This strategy requires that histogram to be greater than zero, meaning the MACD line is above its signal line. A fresh MACD cross on the same candle is not required. The histogram does not need to rise from the previous reading. Required indicator data must be available.
02 · Read the example
A new EMA cross. MACD already positive.
Illustrative chart · Fictional readings, not a recorded trade
Solid line: EMA 9. Dashed line: EMA 20. Shading marks the 8:45 a.m. Central reading.
At 8:44, EMA 9 is 599.98, below EMA 20 at 600.00. At 8:45, EMA 9 is 600.03, above EMA 20 at 600.01.
The MACD histogram falls from +0.04 to +0.03. It stays positive. This example passes the setup rules even though MACD does not cross again.
Near-miss: positive MACD, no new EMA cross
Keep the same time and positive MACD. Suppose EMA 9 was already above EMA 20 at 8:44 and stays above at 8:45. This fails: the previous EMA spread was not below zero.
Qualifying under the setup rules does not predict profit. Risk controls must still permit an entry.
03 · Locate the risk rules
Apply Risk after Strategy
Saved configuration: September 30, 2026 · Simulation context. These settings describe the saved model, not verified live behavior.
Select the contract and apply entry controls
The saved entry model selects an at-the-money SPY call and uses the ask price for simulation. At the money means the strike is near the underlying price. The configured budget is $150, with a $250 maximum single-trade sizing setting and a $0.05 minimum quoted option premium. The risk profile permits one open position per ticker and direction. A qualifying setup does not guarantee an entry or an available contract within those controls.
Define the stop and profit rules
The saved option risk profile sets a hard stop at −18% and a take-profit trigger at +40%. Profit protection starts at +10%, with further 10-percentage-point ratchet steps. These percentages refer to the option position, not SPY’s share-price change. A ratchet raises the protection level as the recorded peak return advances. An exit trigger does not guarantee a fill at its threshold.
Check the position after four and eight minutes
At four minutes or later, the never-positive rule calls for an exit if the recorded peak return remains at or below 0%. At eight minutes or later, the time rule calls for an exit if the current return is +10% or lower. That second check uses the current return, even if an earlier peak exceeded +10%. The saved profile also includes an exit after 20 minutes when the current return is negative. These are conditional checks, not a fixed holding period.
04 · Quick check
Does this example meet the setup rules?
At the marked 8:45 point, EMA 9 crosses from below EMA 20 to above it. Change only the MACD histogram to zero. Does the setup qualify?
Keep a reference
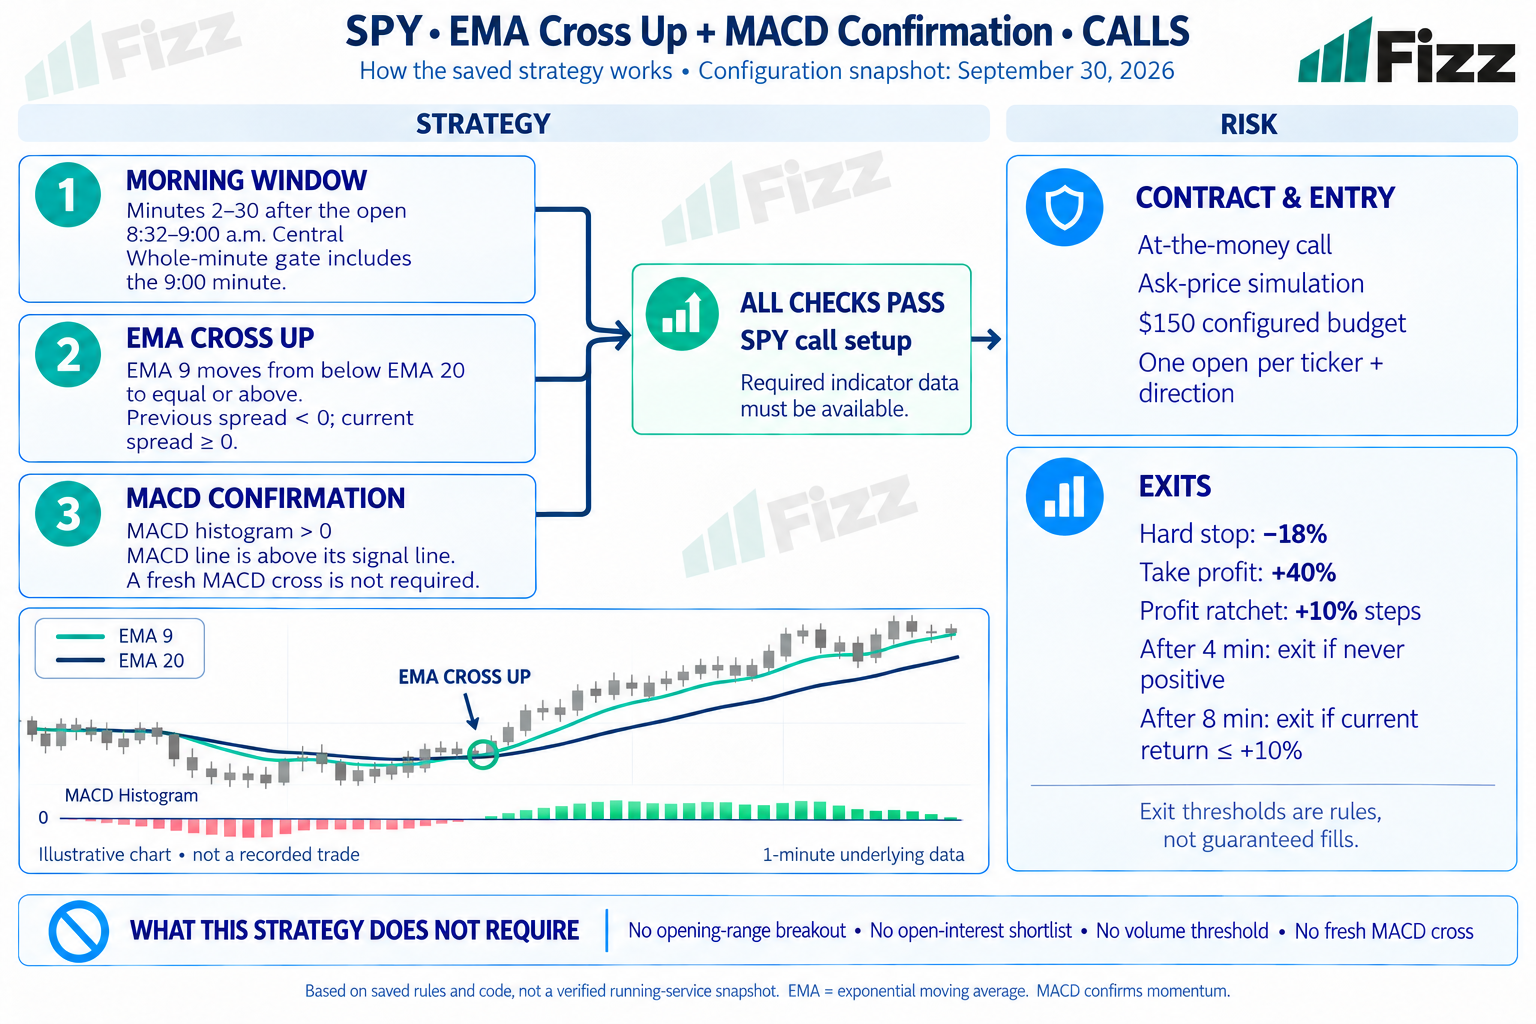
Use the poster to review the sequence after the lesson.
About this configuration
The idea behind the setup
This strategy checks whether SPY’s short-term trend turns upward while momentum supports the move. It combines a morning entry window, an upward EMA cross, and a positive MACD histogram. All three requirements must pass together. This guide explains EMA – Cross Up + MACD Confirmation (SPY) – CALLS using the saved September 30 configuration. The chart is illustrative, not a recorded trade.
Compare it with Morning OI Momentum
Morning OI Momentum combines an options open-interest shortlist with an opening-range condition. This EMA strategy requires neither. It also has no volume threshold in its entry conditions. Its decision rests on the morning window, the upward EMA cross, and positive MACD. Use the diagram to follow those requirements into the separate risk rules.
Read the diagram as a configuration guide
The diagram covers Strategy and Risk. Its candle chart is illustrative and shows no historical price, fill, or performance result. Fizz checked the saved strategy, linked risk settings, and indicator code for this lesson. The saved configuration uses simulation; this review does not verify a running service or establish a win rate. Later settings can differ. A signal, an exit trigger, and a completed trade are separate events.
Lesson details
Owner: Fizz product team · Article reviewed: September 30, 2026