
8-minute lesson · Strategy education · CALLS and PUTS
S3 / S4: tight tape, volume, and confirmation
Learn how tight tape, qualifying volume, and a completed breakout work together in both directions. See how research measures historical wins for each ticker.
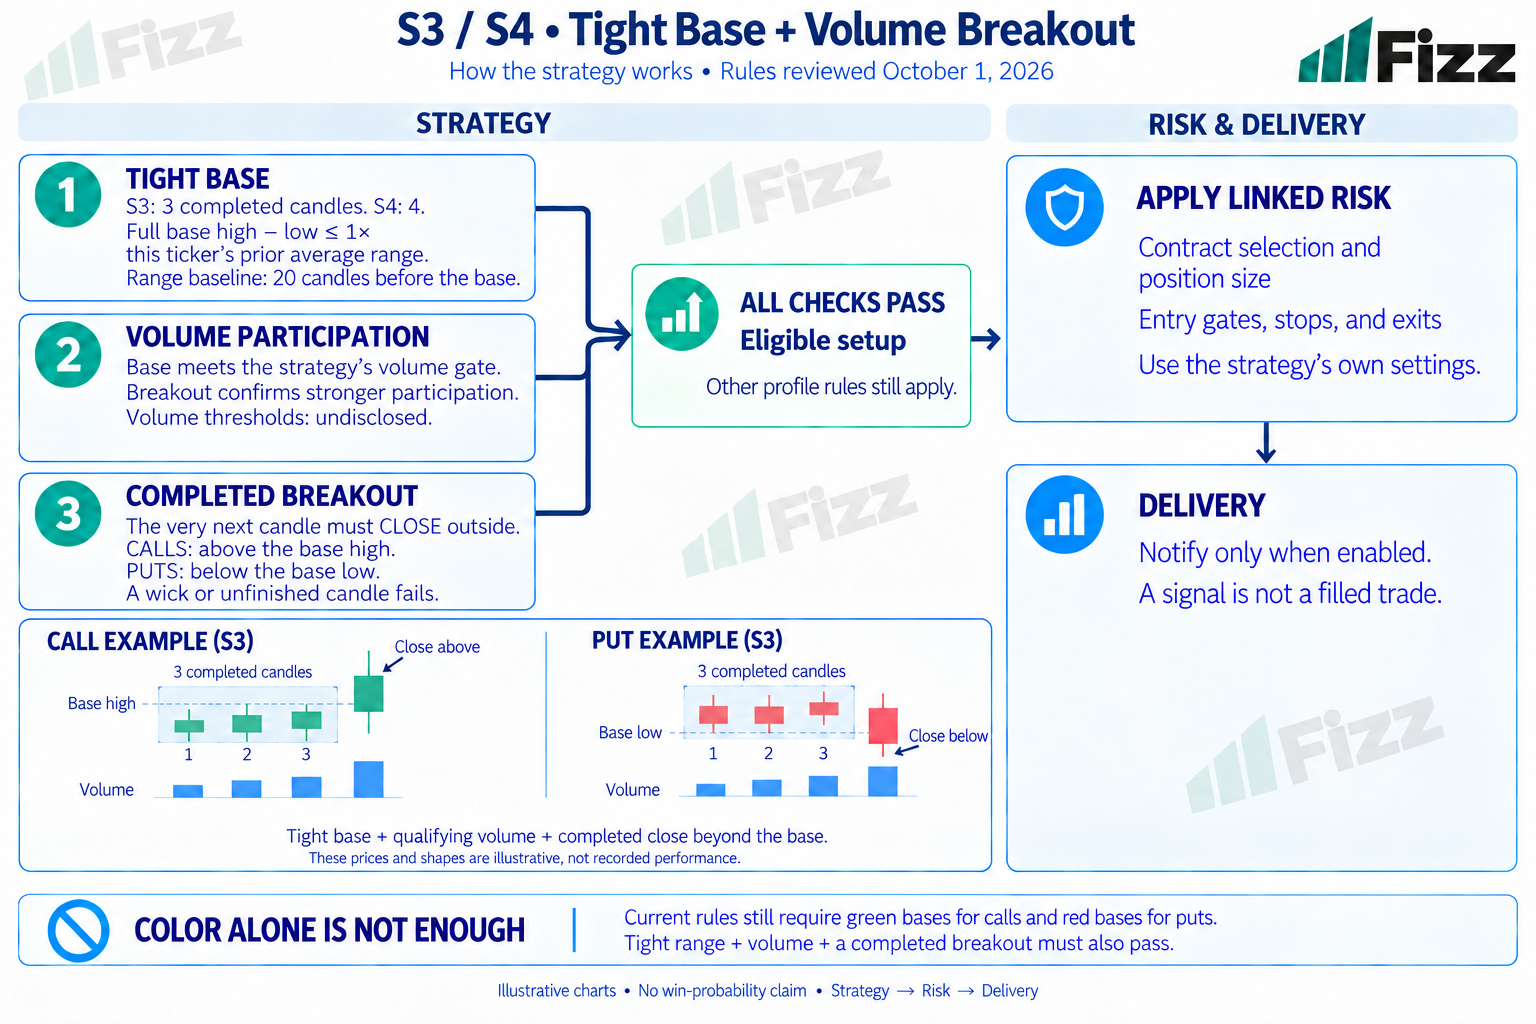
Read the diagram from left to right: a compact base and qualifying volume need a completed breakout. The three candles show the S3 base; the separate fourth candle confirms it. S4 uses four base candles before confirmation. Both directions require more than candle color.
01 · Read the tape
Tight range, volume, and confirmation work together
A row of green or red candles is only the starting pattern. The full base must stay compact, participation must qualify, and the next completed candle must confirm the break.
S3 means three candles; S4 means four
The setup uses three or four consecutive completed one-minute stock candles. Calls require green candles that close near their own highs. Puts require red candles that close near their own lows. The saved close tolerance is 0.1% of the stock price, not 10% of the candle range. Some profiles also require preceding opposite-color candles, a time window, or other conditions. These filters still apply.
What a tight tape means
Look for the setup candles to stay close together in price. Measure the entire base from its highest high to its lowest low, including the wicks. That span must be no wider than this ticker’s average one-minute high–low range over the 20 completed candles before the base. The default multiplier is 1.0. This is one ticker’s recent range, not an average across tickers, an ATR reading, or a fixed 15-cent limit. Small candle bodies alone do not establish a tight base.
Why volume matters
Fizz checks stock participation across the base and stronger participation on the breakout candle. Both must meet the strategy’s volume rules. Volume thresholds are undisclosed; the public guide does not publish share totals, averages, or confirmation multiples. Volume describes underlying shares, not option premium or proof of institutional buying. A compact group of candles alone cannot pass the volume checks.
Wait for the next completed candle
The candle immediately after the base must close strictly above the base high for calls, or below the base low for puts. Its volume must also pass the private confirmation threshold. A wick beyond the boundary, an equal close, or a forming candle does not qualify. A later break several candles afterward does not rescue this base. Candle color, tight range, and participation must work with the completed breakout.
02 · Check the numbers
Follow one fictional S3 setup
A passing S3 call example
Suppose three green stock candles form a base between $100.00 and $100.12. The ticker’s pre-base average range is $0.15, so the $0.12 base passes. Assume its volume also passes the private base check. The next candle closes at $100.16 and passes the separate confirmation-volume check. The setup qualifies only if all remaining profile conditions also pass. The three base candles and fourth confirmation candle have different jobs. This is a fictional example, not a recorded trade.
A near miss still fails
With the same $100.12 base high, a next candle that trades to $100.18 but closes at $100.10 fails. A close at exactly $100.12 also fails. A $100.16 close with insufficient confirming volume still fails. Puts mirror the price rule below the base low. Missing minutes or invalid data prevent confirmation. Candle color alone, or tight candles without the full volume and breakout checks, does not complete the setup.
03 · Understand the evidence
How Fizz researched each ticker
Research starts with each ticker separately
The September 11 study replayed completed one-minute candles for 45 tickers. It kept 360 separate ticker, streak, and direction combinations across S1 through S4, including losing combinations. AAPL S4 calls and TSLA S4 calls therefore had separate samples. Calls and puts also stayed separate. This initial stock screen omitted RSI, prior reversal, and extra time-window filters. It did not reproduce every deployed option strategy.
Replay a fixed entry and outcome
The study entered at the next minute’s open and measured directional stock returns after 8, 15, and 30 minutes. Its win-rate table used the 30-minute result. Each sample required all 30 minute bars; incomplete attempts stayed outside the measured outcomes. Each ticker/setup/direction combination allowed one position at a time. Development covered September 11, 2024–December 31, 2025. The later retrospective comparison covered January 1–September 11, 2026. The stock screen applied no fees, stop, or option pricing model.
Calculate an observed win rate
Observed win rate equals positive measured outcomes divided by all measured outcomes in that exact sample. A flat outcome is not a win. For example, 60 positive outcomes out of 100 measured trades gives 60%. That is a fictional calculation, not a Fizz performance claim. Always read the ticker, direction, rule version, exit horizon, date range, and sample count beside a percentage. An observed frequency estimates past behavior; it is not a known probability for the next trade.
| Ticker | Setup | Trades | Stock win rate | Mean stock return |
|---|---|---|---|---|
| AAPL | S3 calls | 1,173 | 50.47% | +0.0094% |
| AAPL | S4 calls | 793 | 52.33% | +0.0349% |
| TSLA | S3 calls | 1,305 | 47.97% | −0.0025% |
| TSLA | S4 calls | 867 | 48.67% | +0.0096% |
The AAPL and TSLA examples show differences between tickers and between S3 and S4. They are not a ranking. Download all 180 S3/S4 ticker, setup, and direction rows for this period.
A higher win rate can still lose money
Win rate does not measure the size of wins and losses. The research also reported average return, worst outcome, and drawdown, which measures decline from an earlier cumulative peak. Small samples, missing history, and repeated trades on similar days limit certainty. Selecting the strongest result after examining many combinations can exaggerate its strength. The later period was retrospective, not fresh forward proof. The study treated all combinations as exploratory and did not validate a live winner.
Why the new setup needs its own results
The October 1 relative tight-base and volume-breakout rules change which entries qualify. The earlier stock win rates do not establish an option win probability for this version. A separate fixed-15-cent S4 call screen found 30 positive stock outcomes out of 48, or 62.5%, limited to RIVN and SMCI. It used different rules and costs, so that figure is not the new setup’s probability. The September 29 option study also compared older entries using ask-to-buy, bid-to-sell pricing and fees. None of these studies supplies a calibrated per-ticker win probability for the updated rules. That requires new version-specific option outcomes and independent validation.
04 · Separate a setup from a trade
Apply the strategy’s own risk rules
Strategy, Risk, and Delivery have separate jobs
Strategy identifies the setup. The linked Risk rules control contract selection, sizing, entry gates, and exits. Delivery controls notifications. An eligible stock pattern does not guarantee an option fill or a Discord alert. S3/S4 profiles can have different risk settings and delivery permissions. Read the exact profile instead of applying one stop, target, or budget to the whole family.
Use the checklist on the next chart
Count three or four completed directional candles. Measure the full base against that ticker’s prior average range. Check whether base participation qualifies. Wait for the next completed close outside the base with qualifying confirmation volume. Exact volume thresholds remain private. Then check the remaining profile conditions and its risk rules. The setup explains when a signal can qualify; the research explains what evidence supports it and what remains unmeasured.
Lesson details
Owner: Fizz product team · Article reviewed: October 1, 2026